Introduction to Nepalese Economy
Nepal, a small nation with a Hindu-majority population, is located between India and China, with the Himalayas to the north. It is considered to be one of the world’s least developed countries, lacking significant resources for economic growth. The economy is heavily reliant on importing basic materials and exporting forest and agricultural products to foreign markets. Essential commodities like fuel, construction materials, fertilizers, metals, and consumer goods are mainly imported, while exports, primarily consist of carpets, beverages, textiles, tea, animal or vegetable fats and oils.
Nepal is home to some of the World’s most rugged and challenging mountain terrain, with approximately 75 percent of the country covered by mountains. The country can be divided into three main physical regions extending from east to west:
1. The Tarai region, which is a low-lying and flat, fertile land located adjacent to the border of India.
2. The mid-hill region, situated between the Mahabharata Range and the Great Himalayas.
3. The Himalayan region, covering the entire Himalayan range and including peaks that rise to over 29,000 feet, with Mount Everest being the highest at 29,031.69 feet or 8,848.86 meters.
Following are some of the economic indicators of Nepalese economy:
a. GDP and Economic Growth: Economic growth is the increase in the value of real GDP over the period of time. In terms of growth rate, the growth rate of Nepal exceeded the growth rate of India and China in 2017, 2018 and 2019. In 2020 the growth rate was – 1.9. In the following year the growth rate is expected to rise to 2.9 percent.
Following table shows the growth rate of Nepal compared to its neighbor countries:
b. Gross National Income (GNI): Gross National Income is the value of all the final goods and services produced in a country plus the net factor income from abroad within a year.Net factor income from abroad is the difference between the factor income earned by the residents abroad and the factor income earned by the foreigners in the domestic territory of that country. The value of GNI in 2019 was Rs.3898.85 arba. It was Rs. 3960.80 arba in 2020.
c. Unemployment: According to the Central Bureau of Statistics (CBS) 2017/18 at the time of survey, Nepal had 2.07 crores people of working age group and out of them 11.4 percent were unemployed. Females reported a higher number of unemployment rate which was 13.1 percent.
d. Per Capita Income (GNP per Capita): It is the total GNP divided by the total population of a country. It represents an average income of an individual in a particular year. Following table shows the GDP Per Capita from the year 2015.
GDP Per Capita since 2012 has declined once in 2016 and again in 2020. In the past it has been highly fluctuating which is a bad indicator for development.
e. Price Level: It is also called general price level. The inflation rate is calculated using the price increase of a defined product basket. This product basket contains products and services on which the average consumer spends money throughout the year. They include expenses for groceries, clothes, rent, power, telecommunications, recreational activities, and raw materials (e.g. gas, oil), as well as federal fees and taxes. The change in general price level affects the spending and saving of the people and thus affects the national income. Thus, price stability must be maintained for sustained growth and development. Following table shows the inflation rate of South Asian countries with china as well.
An inflation rate below 3 percent is beneficial for the economy as it increases demand and output of the country but since 1980 the inflation of Nepal has never been below 3 percent. Inflation after 2017 has fallen sharply from 4.5 percent to around 4.1 percent on an average till 2018 and has increased to 6.1 in 2020. It is expected to fall to 4.2 in 2021. Some increase in inflation is expected from higher public sector salaries, import duties on agricultural and industrial goods (to support import substitution policies), and services. As the inflation depends upon cost of imports and Nepal imports goods from India in a large amount, inflation of Nepal also depends upon inflation of India.
f. Balance of Trade: It is the difference between a value of the country’s exports and imports for a given period. If exports exceed imports then it is called trade surplus and if imports exceeds exports then it is called trade deficit. In 2019 Nepal had a negative trade balance of 1321.4 Arba and in 2020 it is 1099.1 arba.
g. Poverty: The estimated poverty headcount ratio (the percentage of the population living below the national poverty lines i.e., USD 1.90 per person per day international poverty line) is 18.7 percent in 2018 and is expected to be 16.67 in 2020. Despite the declining poverty trend, vulnerability remains high in Nepal. Poverty is likely to be increased due to the prevalence of covid-19.
Following are some of the major macroeconomic indicators of Nepal
Contemporary Features/Characteristics of Nepalese Economy
Nepalese economy is affected by numerous factors like, its land topography, religions, cultures, casts, ethnic groups, political factors etc. With diversity in caste, ethnic groups, languages and cultures where Nepal is recognized for its religious tolerance and harmony, while some of the deeply rooted religious beliefs and traditions can sometime act as a hinder to the development of a country. Like the tradition of early marriage which still persists in some parts of the country has blocked the way for women empowerment, gender equality and many more. The importance of son in a family has resulted consequences like high population growth, poverty, low income etc. These consequences finally shape the features of Nepalese economy. While some features of Nepalese economy has uplifted the economic condition of the nation whereas some other features are responsible for the low development. Some of the specific characteristics of Nepalese economy are explained below:
1. Low Per Capita Income: It is the total GDP divided by the total population of a country. It represents an average income of an individual in a particular year. GDP Per Capita since 2012 has declined once in 2016 and again in 2020. In the past it has been highly fluctuating which is a bad indicator for development.
2. Mass Poverty: The estimated poverty headcount ratio (the percentage of the population living below the national poverty lines i.e., USD 1.90 per person per day international poverty line) is expected to be 16.67 percent in 2020, down from 18.7 percent in 2018. Despite the declining poverty trend, vulnerability remains high in Nepal. Prevalence of COVID-19 further increases the vulnerability.
3. Underutilization of Natural Resources: Research shows that different areas of country have deposits of minerals like gold, limestone, mica, iron ore, copper, and others. Due to lack of modern technology and skilled labor means Nepal has been unable to produce these minerals at maximum levels.
4. High Trade Deficit: The trade deficit has decreased this year. The trade deficit in 2020 was 1099.1 Arba. Trade deficit in 2019 was 1321.4 Arba. The decrease in trade deficit in this year was due to the decrease in imports relative to exports. The trade deficit is expected to rise to 1287.7 Arba next year.
5. Dualistic and Mixed Economic System: Nepal has mixed economic system means it follows both the capitalistic and socialistic form of economy. Dualistic feature of Nepal depicts the existence of both the traditional and modern sectors. The traditional sector of Nepal relies on agriculture for their livelihood and modern sector relies on manufacturing of goods and services.
6. Rapid Population Growth: The population of Nepal has been steadily rising in recent decades. In the June 2001 census, there was a population of about 23 million in Nepal. The population increased by 5 million from the preceding 1991 census; the growth rate is 2.3%. The current population is roughly 30 million which contributes to an increase of about 3 million people every 5 years. Some reasons for this increased population are early marriage, illiteracy, superstitious social beliefs etc. Rapid population growth has resulted to underemployment. The current population growth rate is 1.36.
7. Remittance Economy: Nepal is highly dependent on remittance income. This is because lack of jobs in market has forced majority of the Nepalese to migrate to foreign countries, especially gulf countries, to earn for a living. The remittance income in 2020 was 875 Arba. Increase in remittance compared to GDP shows the increased dependence of Nepal on other countries.
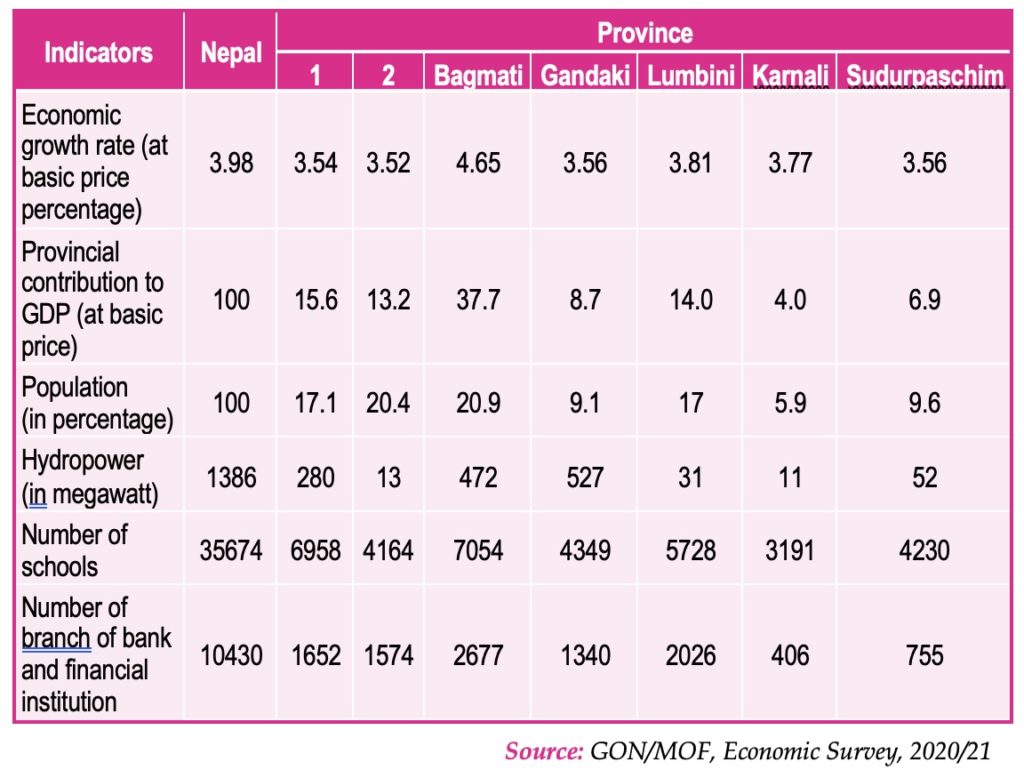
Macroeconomic Indicators of the Central Government of Nepal and the Seven Provinces
The state structure of federal democratic republic of Nepal consists of 7 provinces and 753 local levels. Out of total 753 local levels, there are 460 Rural Municipalities, 276 Municipalities, 11 Sub-Metropolitan Cities and 6 Metropolitan Cities. Some of the macroeconomic indicators of the central government of Nepal and the seven provinces are explained below:
1. Economic Growth Rate: Economic growth refers to the increase in real GDP or output over a period of time. In Nepal, province-wise GDP calculation was started from the fiscal year 2018/19. Among the seven provinces, the highest growth rate was recorded in Bagmati province, which stood at 4.65%, while Province 2 had the lowest growth rate of 3.52%. Bagmati province also had the largest contribution to the total GDP, while Karnali Province had the lowest contribution.
2. Poverty: There are two statistics used to access the poverty situation of each Province, the head count poverty rate and multidimensional poverty rate. According to the economic survey 2018/19, out of total population 18.7% lives in absolute poverty. The highest number of population living under the absolute poverty is in Sudurpashchim. 33.9% of the total population in Sudurpashchim lives in absolute poverty and it should also be noted that out of total population only 9.6% of population lives in Sudurpashchim. The lowest number of population living under the absolute poverty is in Province No.1. 12.4% of the total population in Province No.1 lives in absolute poverty.
3. Inequality: Inequality refers to the unequal distribution of income or wealth or assets among the individuals. It is also known as the gap between the rich and the poor. Inequality is measured with the help of Gini coefficient whose value ranges from 0(which means no inequality) to 1(which means perfect inequality). According to the economic survey 2018/19 the Gini coefficient of Nepal is 0.3.Out of 7 provinces, province No.1, Gandaki and Karnali has the value of 0.4 and the lowest is of Province No.2 with a value of 0.2.
4. Unemployment: Unemployment refers to a situation where a person is willing and able to work but is unable to find any job. As per the economic survey, unemployment rate of Nepal FY 2018/19, highest level of unemployment was in Province No.2 with 20.1% level of unemployment. Bagmati Province had 7% unemployment rate which was the lowest among the 7 Provinces.
5. Life Expectancy: It is the average number of years that a person is expected to live. Average life expectancy of Nepal according to economic survey FY 2018/19 was 69.7. Out of 7 Provinces Gandaki has the highest life expectancy with a value of 71.7 years. Karnali had the lowest with 66.8 years.
Some of the macroeconomic Indicators of the Central Government of Nepal and the Seven Provinces are presented in the table below.